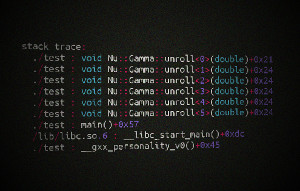
C++ Code Snippet - Print Stack Backtrace Programmatically with Demangled Function Names
Posted on 2008-09-01 22:30 by Timo Bingmann at Permlink with 35 Comments. Tags: #c++ #code-snippet #coding tricks #frontpage
Yesterday I was tasked to analyzed an inner function of a reasonably complex software package. The inner function was called thousands of times from many different parts of the program, a simple counter print-out showed that. However I was interested in which execution paths reach this inner function and how often the different parts access the function.
My straight-forward idea was to dump a stack backtrace each time the inner function is called, similar to the one printed by a debugger. However I needed some code snippet to dump the stack backtrace programmatically, without using gdb to halt the program each time.
Stack backtraces can be saved with backtrace(3), resolved into symbolic names using backtrace_symbols(3) and printed using backtrace_symbols_fd(3). These functions are well documented and fairly easy to use.
However I was debugging a C++ program, which made heavy use of templates and classes. C++ symbols names (including namespace, class and parameters) are mangled by the compiler into plain text symbols: e.g. the function N::A<int>::B::func(int) becomes the symbol _ZN1N1AIiE1B4funcEi. This makes the standard backtrace output very unreadable for C++ programs.
To demangle these strings the GNU libstdc++ library (integrated into the GNU Compiler Collection) provides a function called __cxa_demangle(). Combined with backtrace(3) a pretty stack backtrace can be outputted. The demangling function only works for programs compiled with g++.
The following header file contains a function print_stacktrace(), which uses backtrace(3), backtrace_symbols(3) and __cxa_demangle() to print a readable C++ stack backtrace.
