malloc_count - Tools for Runtime Memory Usage Analysis and Profiling
Posted on 2013-03-16, last updated 2014-09-19 by Timo Bingmann at Permlink.
malloc_count provides a set of source code tools to measure the amount of allocated memory of a program at run-time. The code library provides facilities to
- measure the current and peak heap memory allocation, and
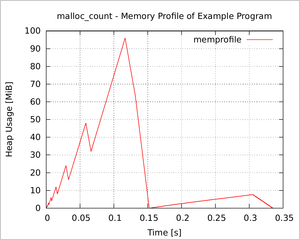
- write a memory profile for plotting, see the figure on the right.
- Furthermore, separate
stack_countfunctions can measure stack usage.
The code tool works by intercepting the standard malloc(), free(), etc functions. Thus no changes are necessary to the inspected source code.
Intercepting Heap Allocation Functions
The source code of malloc_count.[ch] intercepts the standard heap allocation functions malloc(), free(), realloc() and calloc() and adds simple counting statistics to each call. Thus the program must be relinked for malloc_count to work. Each call to malloc() and others is passed on to lower levels, and the regular malloc() is used for heap allocation.
Of course, malloc_count can also be used with C++ programs and maybe even script languages like Python and Perl, because the new operator and most script interpreters allocations all are based on malloc.
The tools are usable under Linux and probably also with Cygwin and MinGW, as they too support the standard Linux dynamic link loading mechanisms.
Memory Profile and stack_count
The malloc_count source is accompanied by two further memory analysis tools: stack_count and a C++ header called memprofile.h.
In stack_count.[ch] two simple functions are provided that can measure the maximum stack usage between two points in a program.
Maybe the most useful application of malloc_count is to create a memory/heap profile of a program (while it is running). This profile can also be created using the well-known valgrind tool "massif", however, massif is really slow. The overhead of malloc_count is much smaller, and using memprofile.h a statistic file can be produced, which is directly usable with Gnuplot.
The source code archive contains two example applications: one which queries malloc_count for current heap usage, and a second which creates the memory profile in the figure on the right. See the STX B+ Tree library for another, more complex example of a memory profile.
Downloads
| malloc_count 0.7.1 (current) released 2014-09-19 | ||
| Source code archive: | Download malloc_count-0.7.1.tar.bz2 (31kb) | Browse online |
The source code is published under the MIT License (MIT), which is also found in the header of all source files.
A git repository containing all sources and revisions is fetchable by runninggit clone https://github.com/bingmann/malloc_count.git
Short Usage Guide
Compile malloc_count.c and link it with your program. The source file malloc_count.o should be located towards the end of the .o file sequence. You must also add "-ldl" to the list of libraries.
Run your program and observe that when terminating, it outputs a line like
malloc_count ### exiting, total: 12,582,912, peak: 4,194,304, current: 0
If desired, increase verbosity
- by setting
log_operations = 1at the top ofmalloc_count.cand adaptinglog_operations_thresholdto output only large allocations, or - by including
malloc_count.hin your program and using the user-functions define therein to output memory usage at specific checkpoints. See the directorytest-malloc_count/in the source code for an example.
Tip: Set the locale environment variable LC_NUMERIC=en_GB or similar to get comma-separation of thousands in the printed numbers.
The directory test-memprofile/ contains a simple program, which fills a std::vector and std::set with integers. The memory usage of these containers is profiled using the facilities of memprofile.h, which are described verbosely in the source.
Thread Safety
The current statistic methods in malloc_count.c are not thread-safe. However, the general mechanism (as described below) is per-se thread-safe. The only non-safe parts are adding and subtracting from the counters in inc_count() and dec_count().
The malloc_count.c code contains a #define THREAD_SAFE_GCC_INTRINSICS, which enables use of gcc's intrinsics for atomic counting operations. If you use gcc, enable this option to make the malloc_count tool thread-safe.
The functions in memprofile.h are not thread-safe. stack_count can also be used on local thread stacks.
Technicalities of Intercepting libc Function Calls
The method used in malloc_count to hook the standard heap allocation calls is to provide a source file exporting the symbols "malloc", "free", etc. These override the libc symbols and thus the functions in malloc_count are used instead.
However, malloc_count does not implement a heap allocator. It loads the symbols "malloc", "free", etc. directly using the dynamic link loader "dl" from the chain of shared libraries. Calls to the overriding "malloc" functions are forwarded to the usual libc allocator.
To keep track of the size of each allocated memory area, malloc_count uses a trick: it prepends each allocation pointer with two additional bookkeeping variables: the allocation size and a sentinel value. Thus when allocating n bytes, in truth n + c bytes are requested from the libc malloc() to save the size (c is by default 16, but can be adapted to fix alignment problems). The sentinel only serves as a check that your program has not overwritten the size information.
Closing Credits
The idea for this augmenting interception method is not my own, it was borrowed from Jeremy Kerr http://ozlabs.org/~jk/code/.
Old Downloads
| malloc_count 0.7 released 2013-03-16 | ||
| Source code archive: | Download malloc_count-0.7.tar.bz2 (30kb) | Browse online |
